
|
|
| Chart Control | Chart Control |
|
type:
size: px;
Download PDB
|
type:
size: px;
Download PDB
|
|
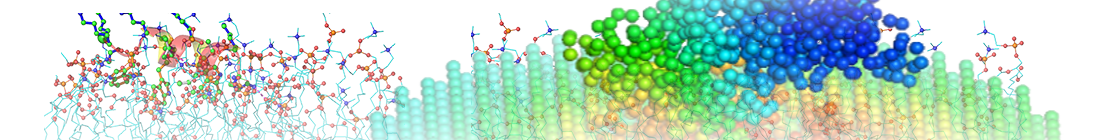
The domains are separated by the signs of eigenvectors and colored red (+) and blue (-) respectively. The side chain of interfacial residues are displayed.
To learn more about how ENM and PCA can define dynamics domains and their uses, visit our sister web site IDD |
|
|
Hide/show:
Hide: Export: Click a point on the 2D chart to show/hide the corresponding labels in both the 2D chart and the 3D windows above if the "Chart Control" is checked. |
|
|
Input file and parameters: PDB title: PHOSPHOLIPASE A2 MODIFIED BY PBPB PDB: 1BK9, chain: all, model No.: 1 Exp. method: X-RAY DIFFRACTION (2.00 Å) Number of system nodes: 124 |