This
page is the user guide to IDD web server (http://dyn.life.nthu.edu.tw/IDD/IDD.php).
1.
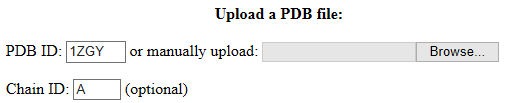
In the webserver, you can
either enter the PDB ID and chain identifier (Chain ID) of the protein or
manually upload a PDB file.
2.
To calculate intrinsic
dynamics domains (IDDs)
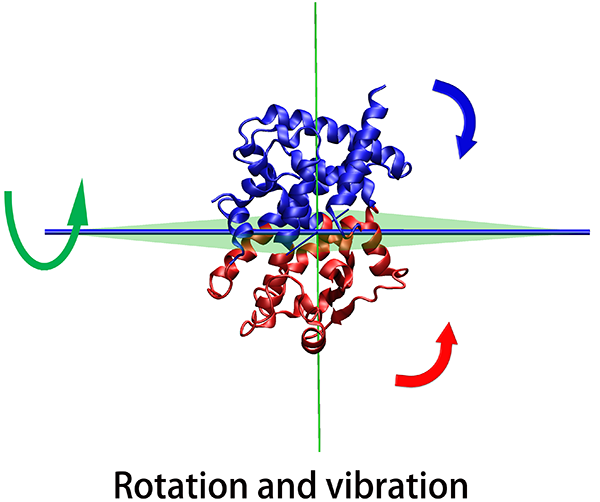
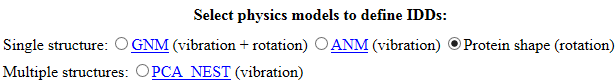
a. for
a single structure, you can choose one of the two elastic network (EN) models
or the geometry based method (referred as PC1 based method in the publication).
The EN model can either be Gaussian network model (GNM (Bahar,
Atilgan, & Erman, 1997)) or anisotropic
network model (ANM, (Atilgan
et al., 2001)).
b. for
multiple structures, please choose the principal component analysis (PCA (Yang,
Eyal, Bahar, & Kitao, 2009)) based method.
3.
If an email address is
provided, the link to the results will be e-mailed (optional).

4.
Press Submit and Run IDDs to
submit the job.
5.
When the calculations are
completed, you will automatically be redirected to the results page.
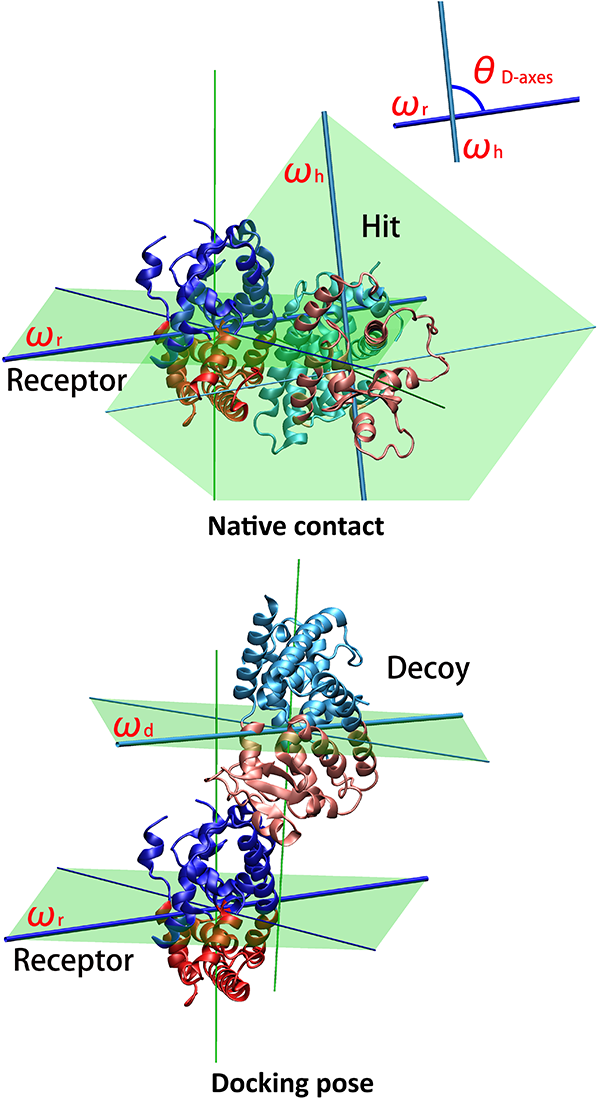
i.
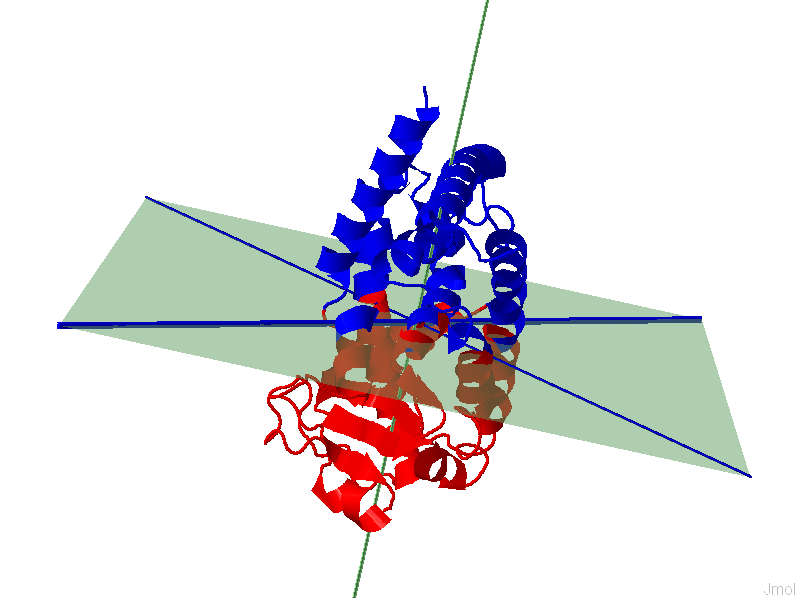
The results page will display a 3D representation of the molecule using JMol. Residues of the same
dynamics domains are colored in either red/blue. The domain plane (D-plane) or
splitting plane (S-plane) and the corresponding normal are
colored in green. The thick blue axis on the plane represents domain axis
(D-axis) or splitting axis (S-axis).
Note:
a. The
results will be available in the server for a period of 30 days.
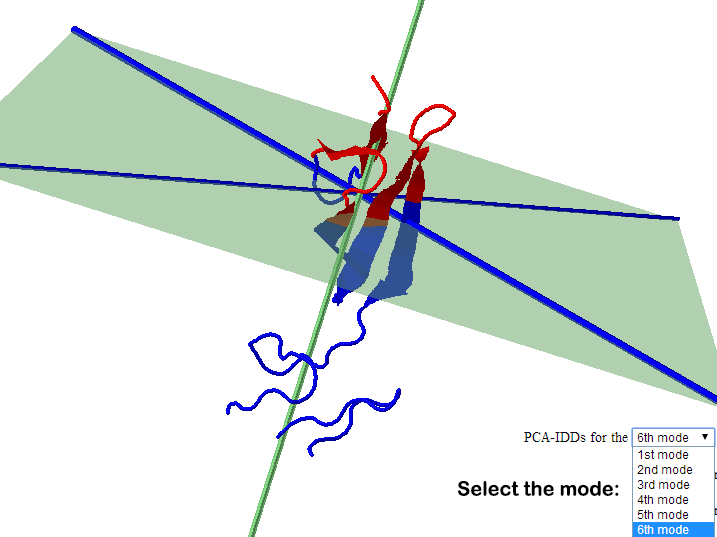
b. The
user can choose to visualize IDDs from each of the first 6 modes in all cases
except shape based IDD.
|
Part
of the result page for shape based IDDs (left) and PCA based IDDs (right)
|
|
PDB
1ZGY , Chain A
|
PDB
2CKU , Chain A
|
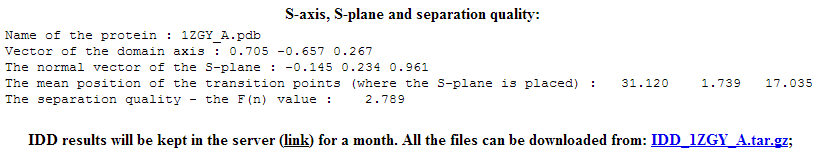
ii.
Details of the IDD
calculation are also shown. The position (mean position of transition points)
of D-plane/S-plane, plane normal and D-axis/S-axis is shown. Also shown is the
direction of the plane normal and D-axis/ S-axis (domain axis). Higher F(n)
value suggests better separation of intrinsic dynamics domains. One can
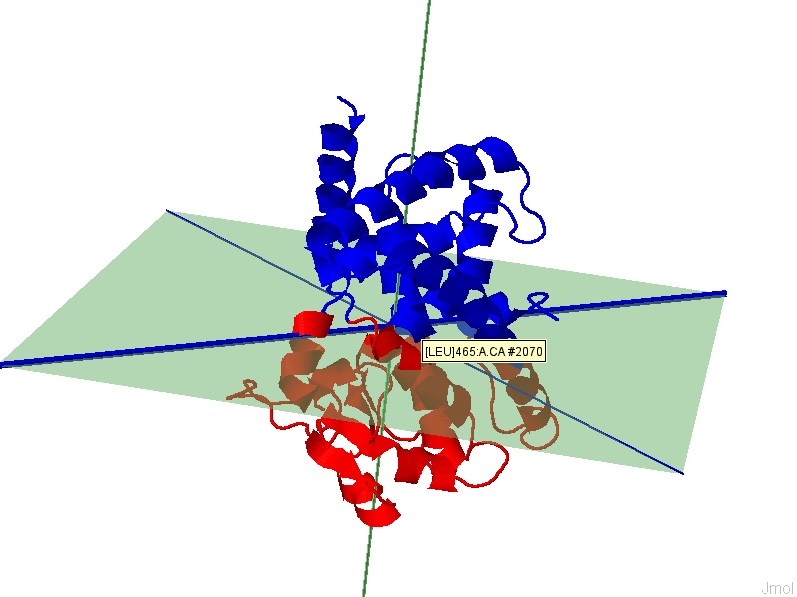
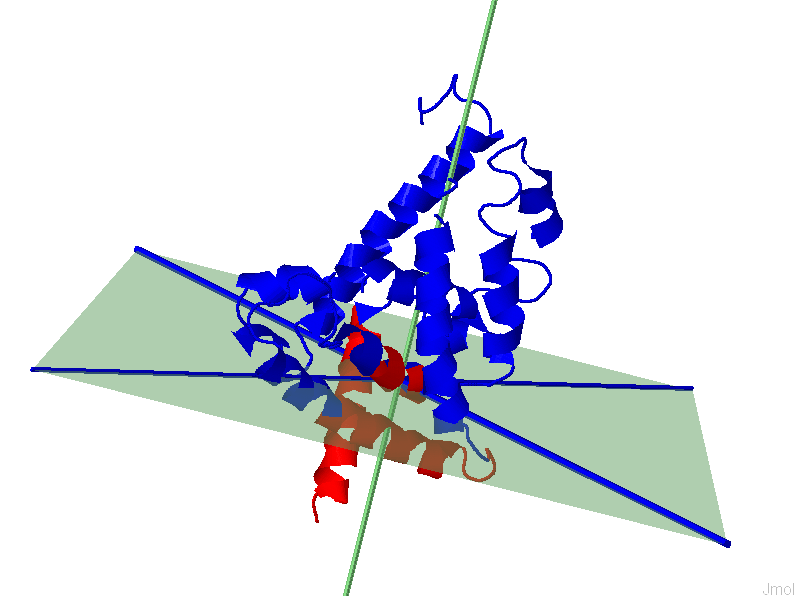
appreciate the implication of separation quality by viewing the figure below. The
results for the 1st (left, F(n)=2.73)) and 6th (right,
F(n)=0.09) modes of GNM based IDD calculations are shown for protein 2F0R,
Chain A. One can notice that a higher F(n) values gives a clearer separation
between Res+/Res- residues.
|
GNM, 1st mode,
F(n)=2.72
|
GNM, 6th mode,
F(n)=0.09
|
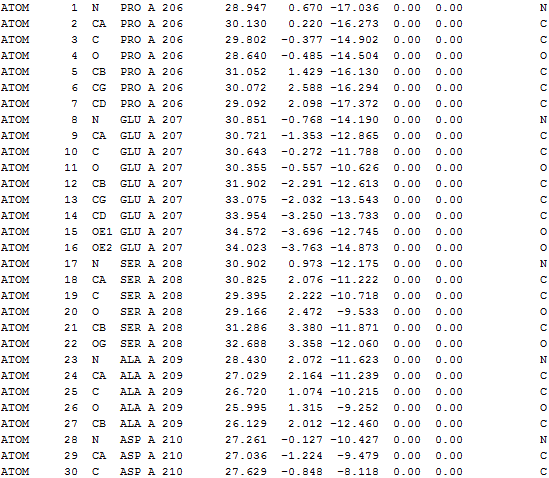
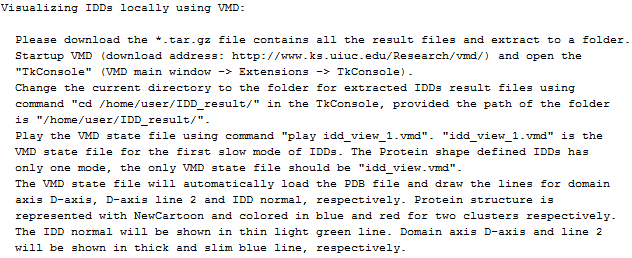
All the output files can be
downloaded as a tar file. The following details can be found in output*.txt in
the tar file. The *.vmd file helps user to visualize the results using VMD
program.
iii.
Downloadable files (also
found in *.tar file). 5 files for each mode.
|
(1) 3D structure of color-coded IDDs
|
PDB
|
|
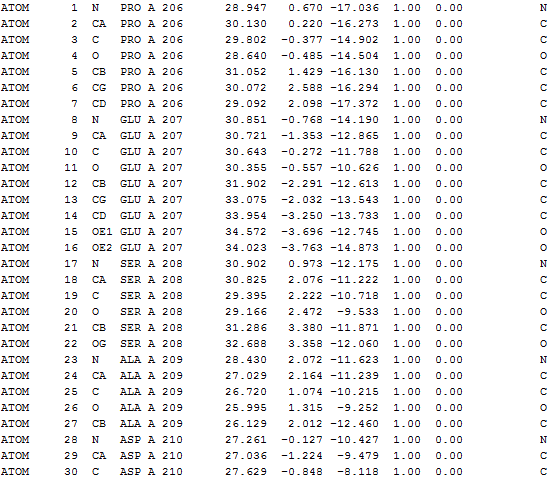
(2) 3D structure of color-coded
Res+/Res- (except in shape based IDD)
|
PDB
|
|
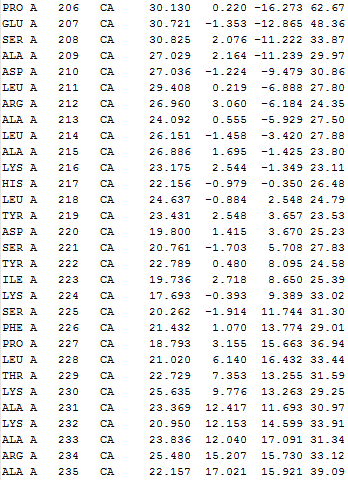
(3) Nodes taken for IDD calculation
|
PDB
|
|
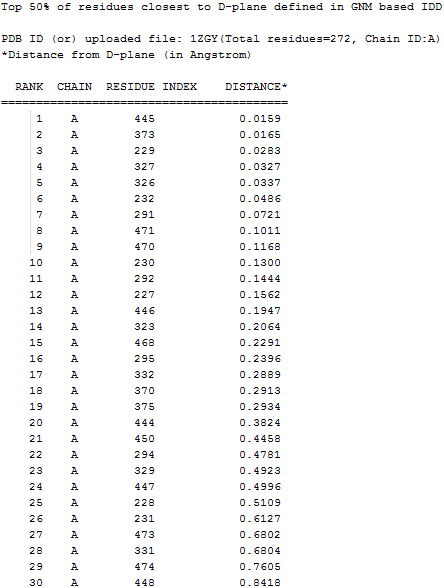
(4) Top 50% residues with the CA atoms
are closest to the D-plane/ S-plane
|
TXT
|
|
(5) Further information (e.g.
visualizing IDDs locally using VMD)
|
TXT
|
Sample
files for each of the results are shown below (PDB: 2CKU, Chain A)
|
3D structure of color-coded IDDs
|
3D structure of color-coded Res+/Res-
|
|
Nodes taken for IDD calculation (only
Cα
atoms)
|
Top 50% residues with the CA atoms are
closest to the D-plane/ S-plane
|
|
Further information
|
6.
JMol and browser plugins
The Results page uses JMol to visualize results
which relies on Java Virtual Machine. We suggest users to install Version 7
Update 55 (released in April, 2014) or higher. When the Results page is
loaded, the JMol applet is automatically started and you will be prompted with
a request from your browser asking if you want to allow it to run. If Java is
not already installed on your computer, please download and install it; if not,
Java can be obtained from the Java
site. More details on JMol can be found from the JMol site.
Reference:
Atilgan, a R., Durell, S. R., Jernigan, R. L., Demirel, M. C.,
Keskin, O., & Bahar, I. (2001). Anisotropy of fluctuation dynamics of
proteins with an elastic network model. Biophysical Journal, 80(1),
505–15. doi:10.1016/S0006-3495(01)76033-X
Bahar, I., Atilgan, a R., & Erman, B.
(1997). Direct evaluation of thermal fluctuations in proteins using a
single-parameter harmonic potential. Folding & Design, 2(3),
173–81. Retrieved from http://www.ncbi.nlm.nih.gov/pubmed/9218955
Yang, L.-W., Eyal, E., Bahar, I., &
Kitao, A. (2009). Principal component analysis of native ensembles of
biomolecular structures (PCA_NEST): insights into functional dynamics. Bioinformatics
(Oxford, England), 25(5), 606–14. doi:10.1093/bioinformatics/btp023