DRS DREAMS
|
DRS DREAMS
|
|
What is DRS DREAMS?
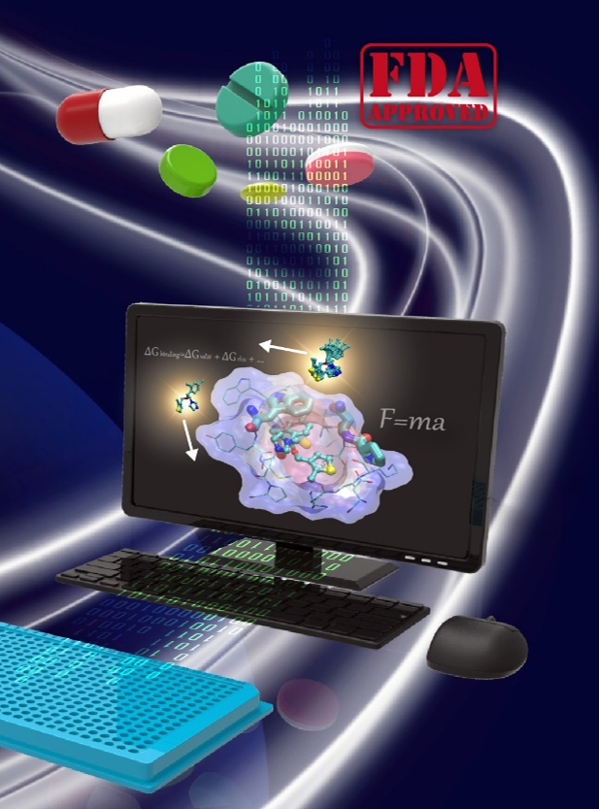
DRS DREAMS is a web server that performs online automatic virtual drug screening of 2016 FDA-approved drugs on a user-submitted target protein. Its goal is to facilitate the drug repurposing to extend the possible treatments toward life-threaten and epidemic diseases. This is achieved by combining the molecular docking and molecular dynamic (MD) simulations to prioritize drugs of strong binders from non-binder. The only things the user required to provide are a well-patched protein structure made of a single peptide chain in PDB format and the target residues IDs to which the drugs expected to bind. A list of drugs, ranked by re-assessing the docking resultes using an unique ranking scheme to prioritize drugs of strong binders from non-binder, will be obtained, and 20 of them can be chosen for MD simulations and binding free energy evaluation. This website is free and open to all users including commercial users and there is no login requirement. Find more in Tutorials. |
 |
|
|
Reference: Tsai,KL. and and Yang,LW. (2021) DRDOCK: A DrugRepurposing platform integrating automated docking, simulation and a log-odds-based drug ranking scheme. doi: 10.1101/2021.01.31.429052 (To be peer-reviewed) Contact: The server is maintained by the Yang Lab at the Institute of Bioinformatics and Structural Biology at National Tsing Hua University, Taiwan. For questions and comments please contact Kun-Lin Tsai.
|